

Wind
Wind rose, speed distribution, prevailing direction and calm hours at the site.
Open Wind from the left rail in Site Intelligence. It uses the same weather station as the Climate panel.
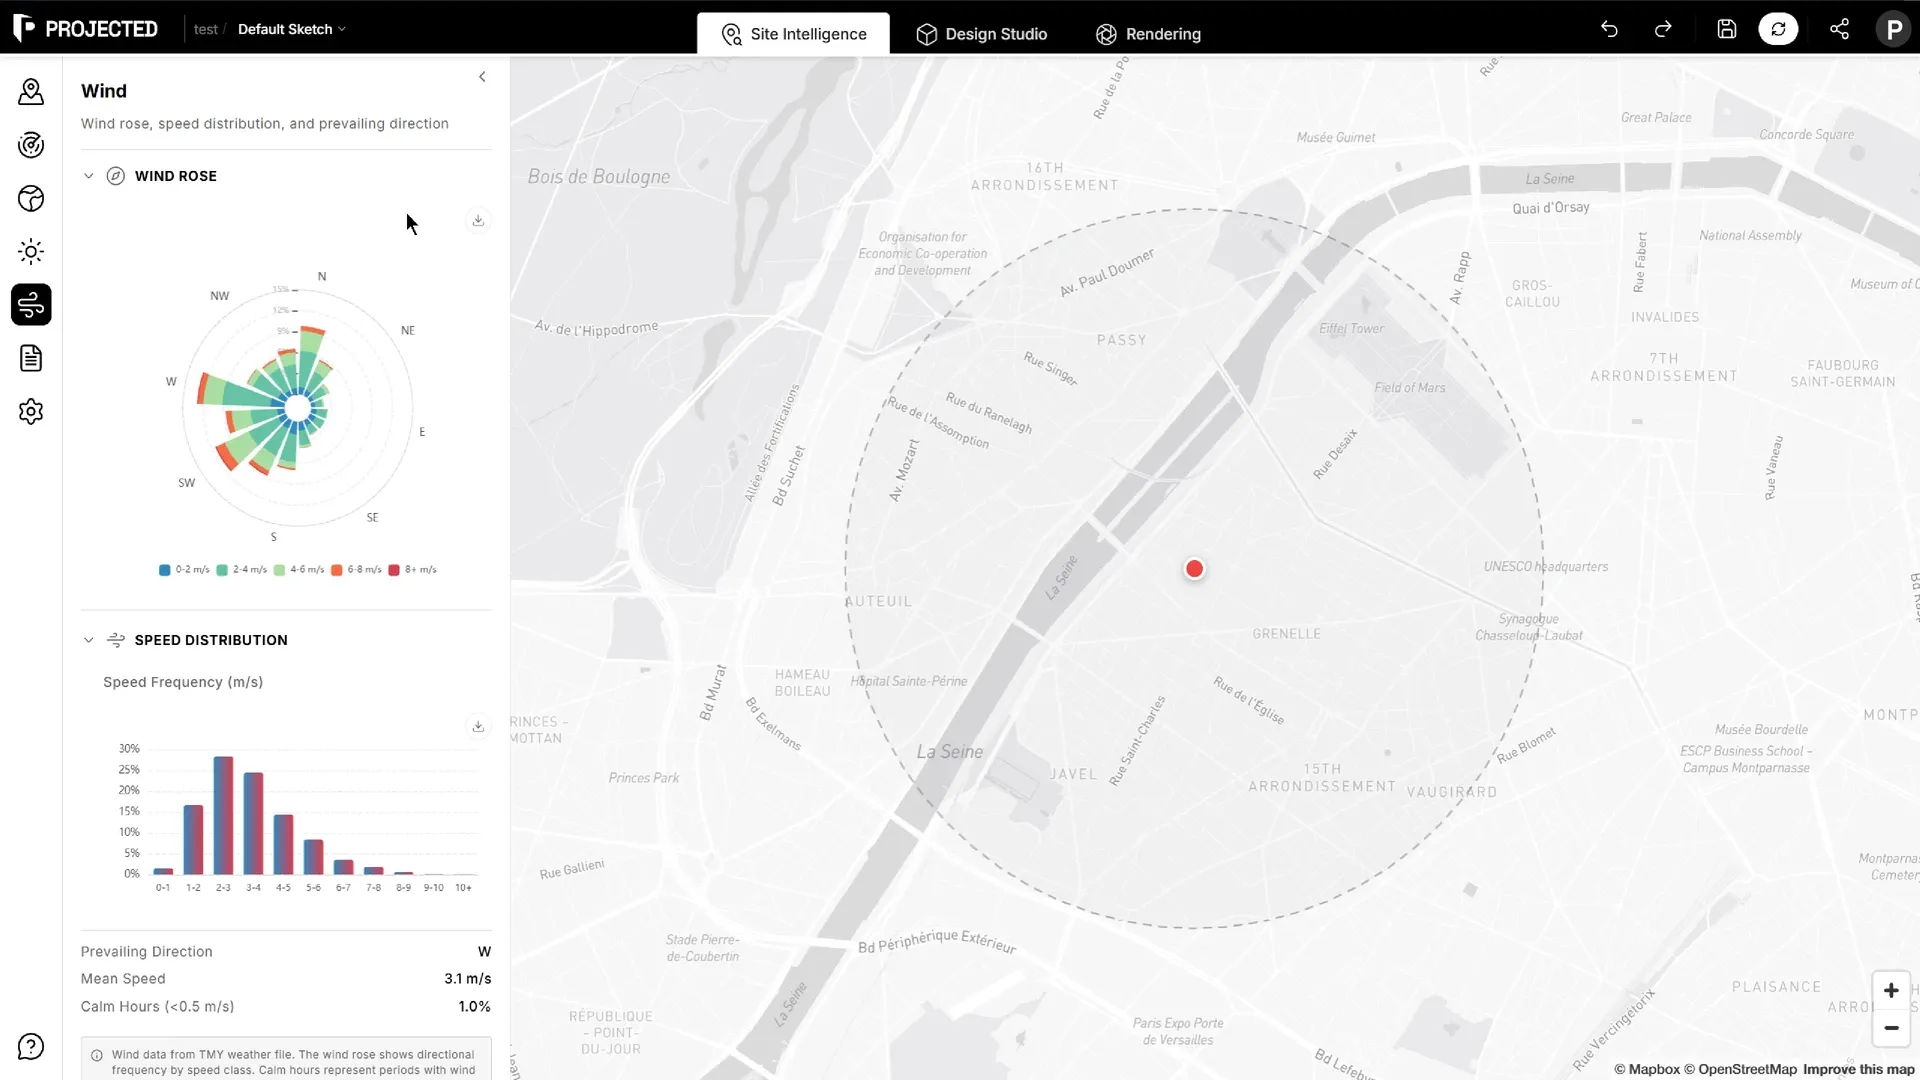
Wind rose
The wind rose shows how often the wind blows from each of 16 directions, over all the hours of the year. Each petal is split into speed classes, in m/s:
| Class | Typical feel |
|---|---|
| 0–2 m/s | Light air, barely felt |
| 2–4 m/s | Light breeze |
| 4–6 m/s | Gentle breeze, leaves moving |
| 6–8 m/s | Moderate breeze, dust and paper lifted |
| 8+ m/s | Fresh wind and stronger, uncomfortable in open spaces |
The longer a petal, the more often the wind comes from that direction.
Key figures
| Figure | What it means |
|---|---|
| Prevailing Direction | The direction the wind blows from most often |
| Mean Speed | The average wind speed over the year |
| Calm Hours | The share of hours with wind below 0.5 m/s |
Speed distribution
Speed Frequency shows the share of the year’s hours in each 1 m/s band, so you can see how often the site is still, breezy or windy.
Using wind data in design
- Place outdoor seating, playgrounds and entrances out of the prevailing wind, or shelter them.
- Use the prevailing direction to plan cross-ventilation.
- Watch out for gaps between tall buildings aligned with strong winds.
Note: The data comes from a weather station, usually at an airport, measured 10 m above open ground. Wind at street level between buildings can be very different.